
How Can We Help?
How to display a gauge with x sections that can be dynamically updated
This tutorial explains how to build a semicircular gauge (speedometer-style) with a configurable number of colored sections, controlled by sliders, and a needle that updates in real time.
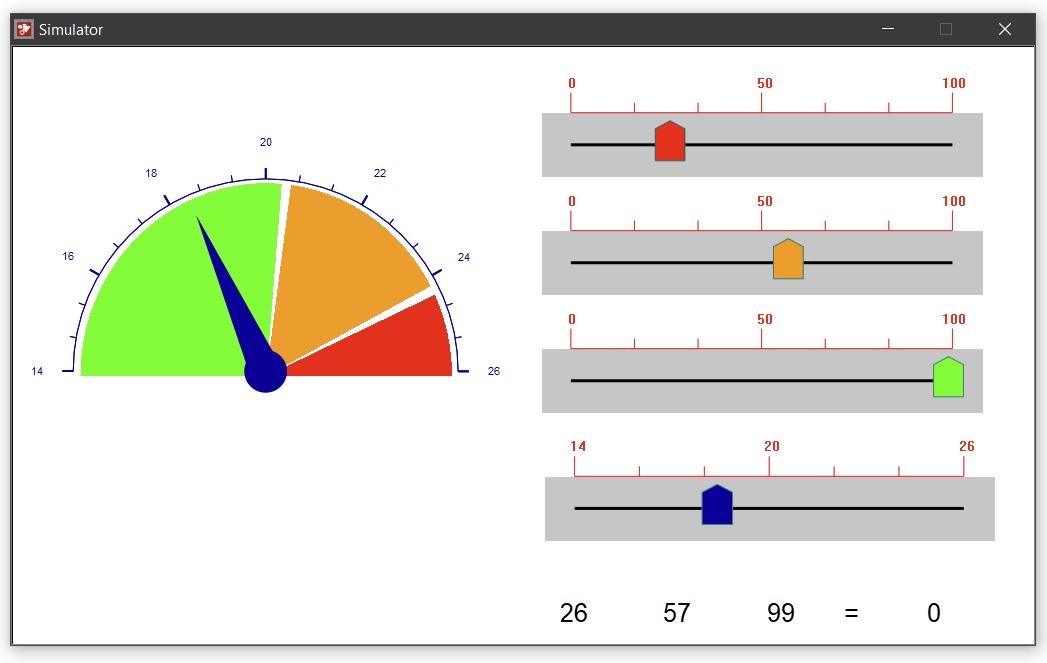
The gauge is made of two main parts:
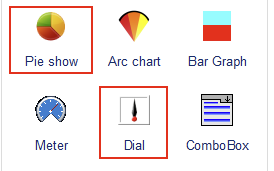
- the “Dial”, the needle that rotates based on a computed value
- the “Pie show”, the colored arc divided into sections
- Data 1, 3 and 5 : Each section covers an angular range on the semicircle (180° total), and its color visually encodes a category or severity zone.
- Data 6 : Is still half of the “Pie Show”, to hiden the below part
- Data 2 and 4 : Other sections, the white sections, which account for only a small percentage of the total and are used to demarcate each coloured section
The script is very basic, and allow to calculate the total for the Data 6, and also the space between each section
#include "MacroInit.h"

//#include "subFun1.c" //Example

void Macro_main(IN *p)

{

MarcoInit

//ToDo

//             Data 1         Space          Data 2         Space          Data 3

LocalWord[5] = LocalWord[0] + LocalWord[1] + LocalWord[2] + LocalWord[3] + LocalWord[4];

LocalWord[1] = LocalWord[5] * 0.02 ; // Data 2 = Space

LocalWord[3] = LocalWord[5] * 0.02 ; // Data 4 = Space

}
You can download the project here